How-to

Estadísticas

Estadísticas (Statistics) allows researchers to find world or regional statistics organized by country or variable.


Access

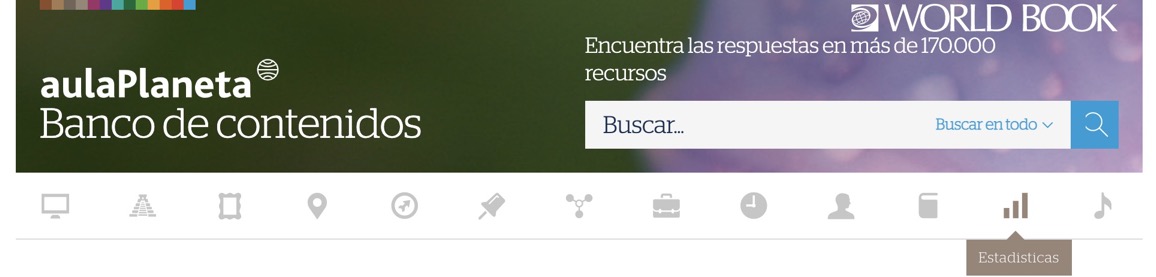
You can find Estadísticas in the feature bar at the top of the homepage, indicated by the brown chart icon.

feature bar

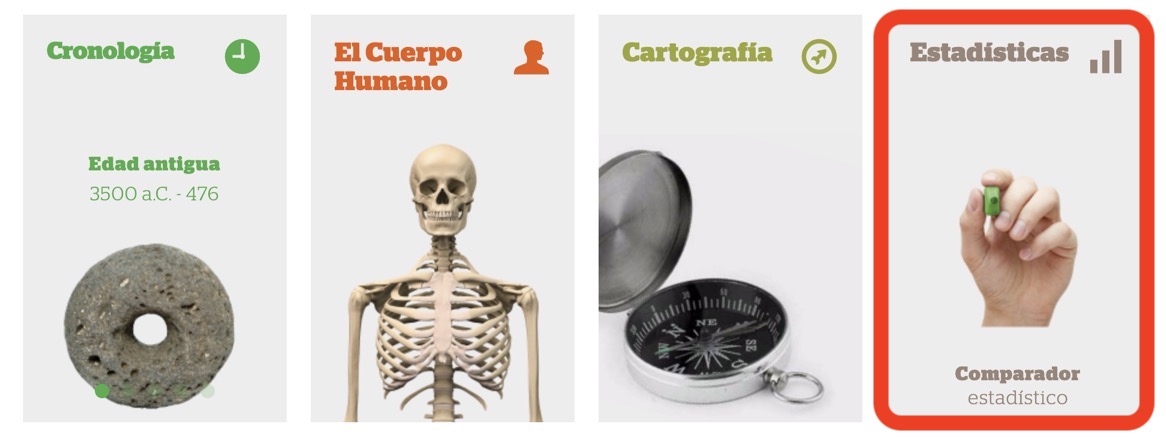
You can also find the Estadísticas feature listed further down on home page, indicated by the matching brown chart icon.

homepage

Statistics by country

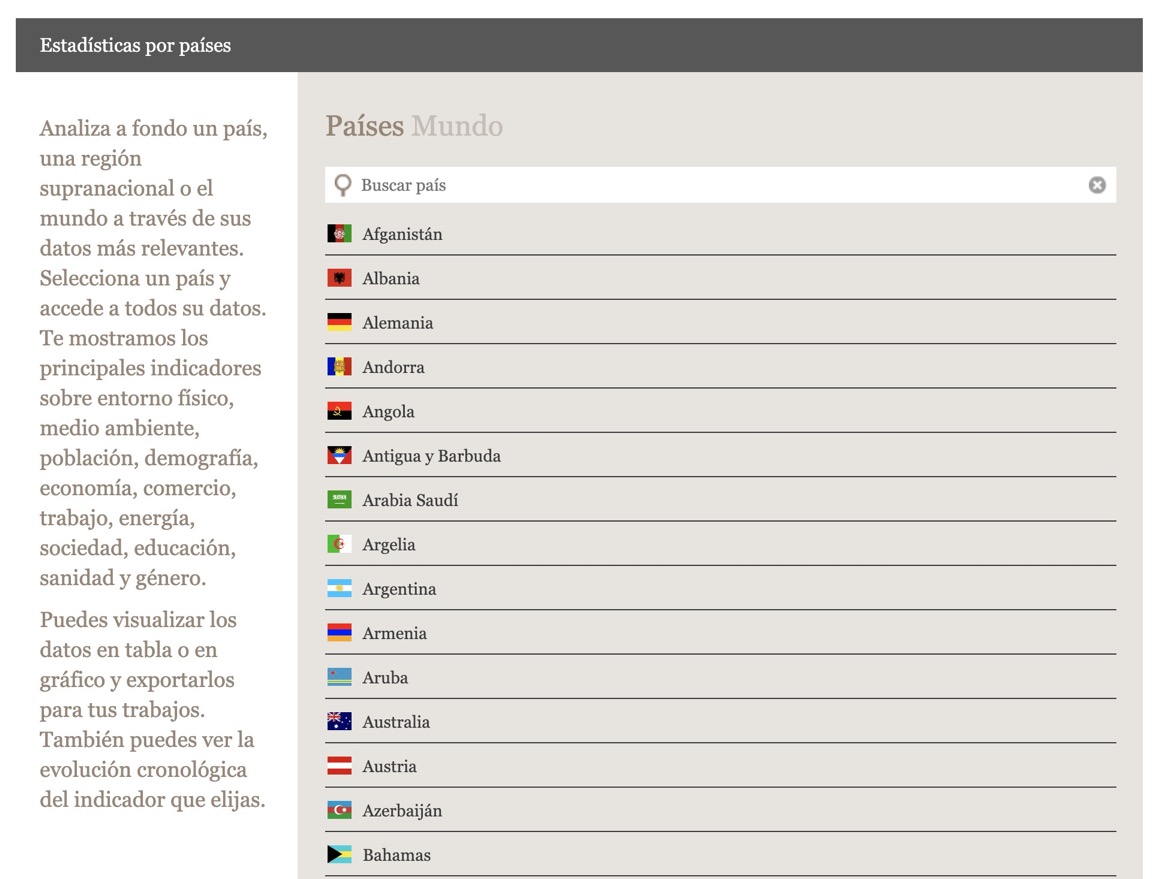
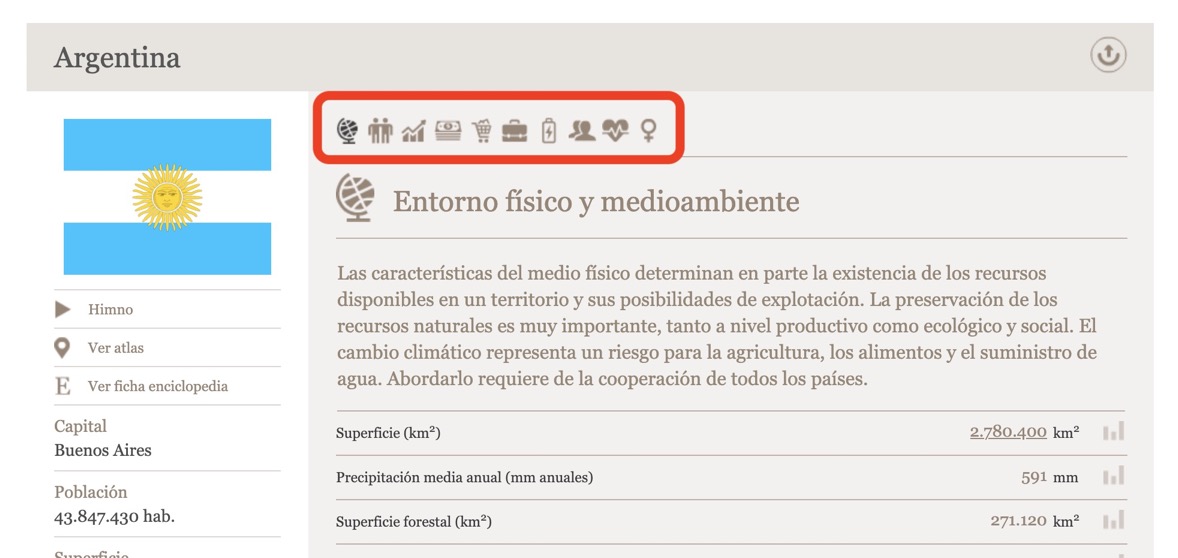
Choose estadísticas por países to view statistics by country. This feature allows users to thoroughly analyze a country, region, or the world through its most relevant data.

  1. Choose estadísticas por países.
    by country
  2. Select a country to access all of the related data.
    select country
  3. Explore the main indicators in the table: physical characteristics, population, demographics, economy, trade, work, energy, society, education and health, and gender.
    indicators
  4. Click on an indicator to view its associated graph.
    graph
  5. Click the download icon in the top right corner to download the data as a .csv file.
    download

Statistics by indicator

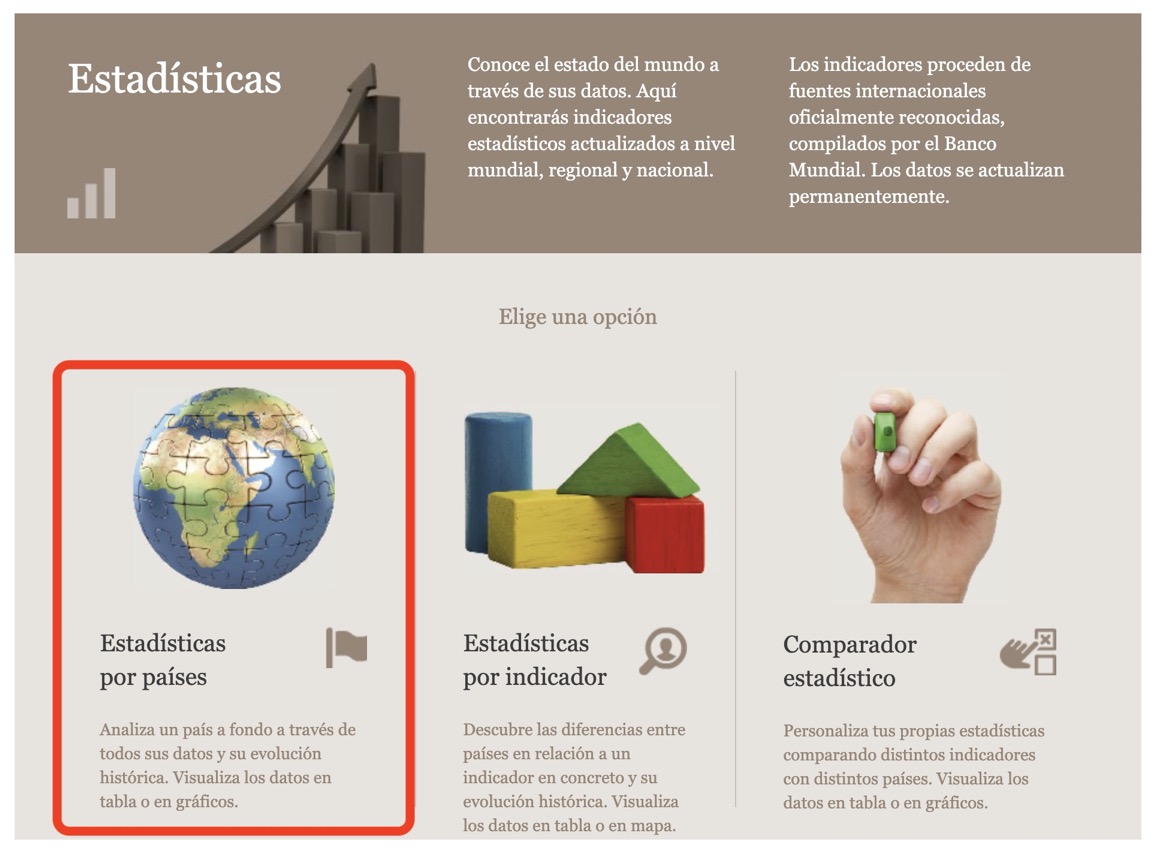
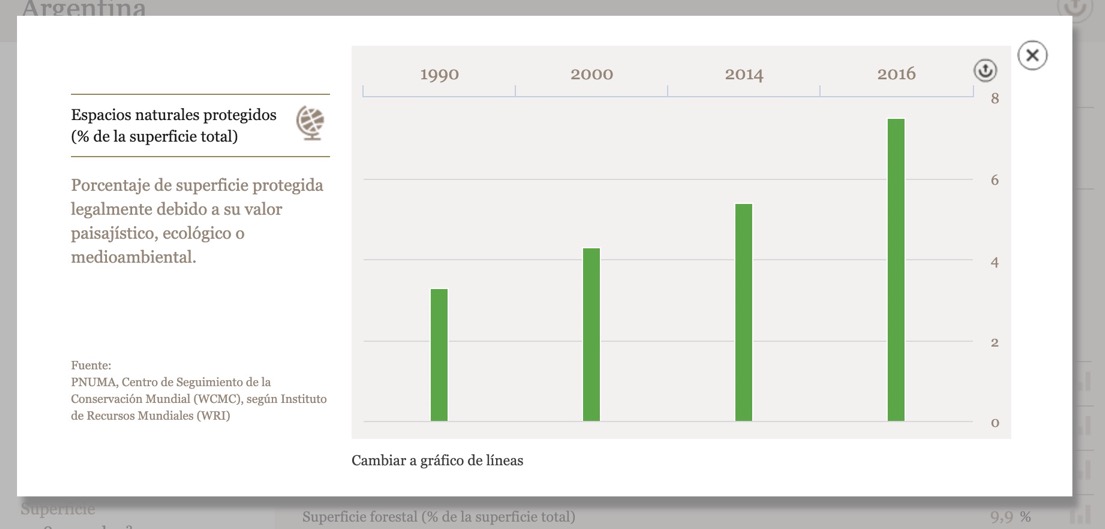
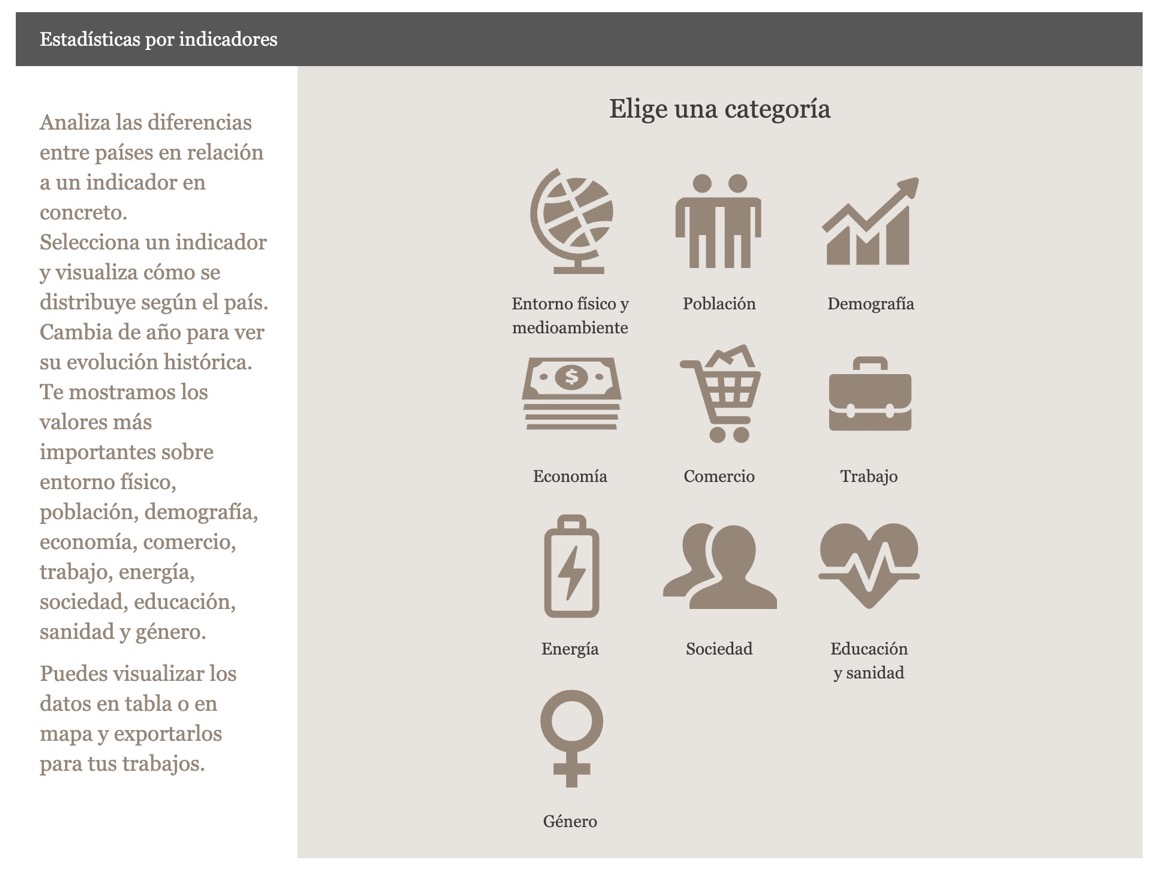
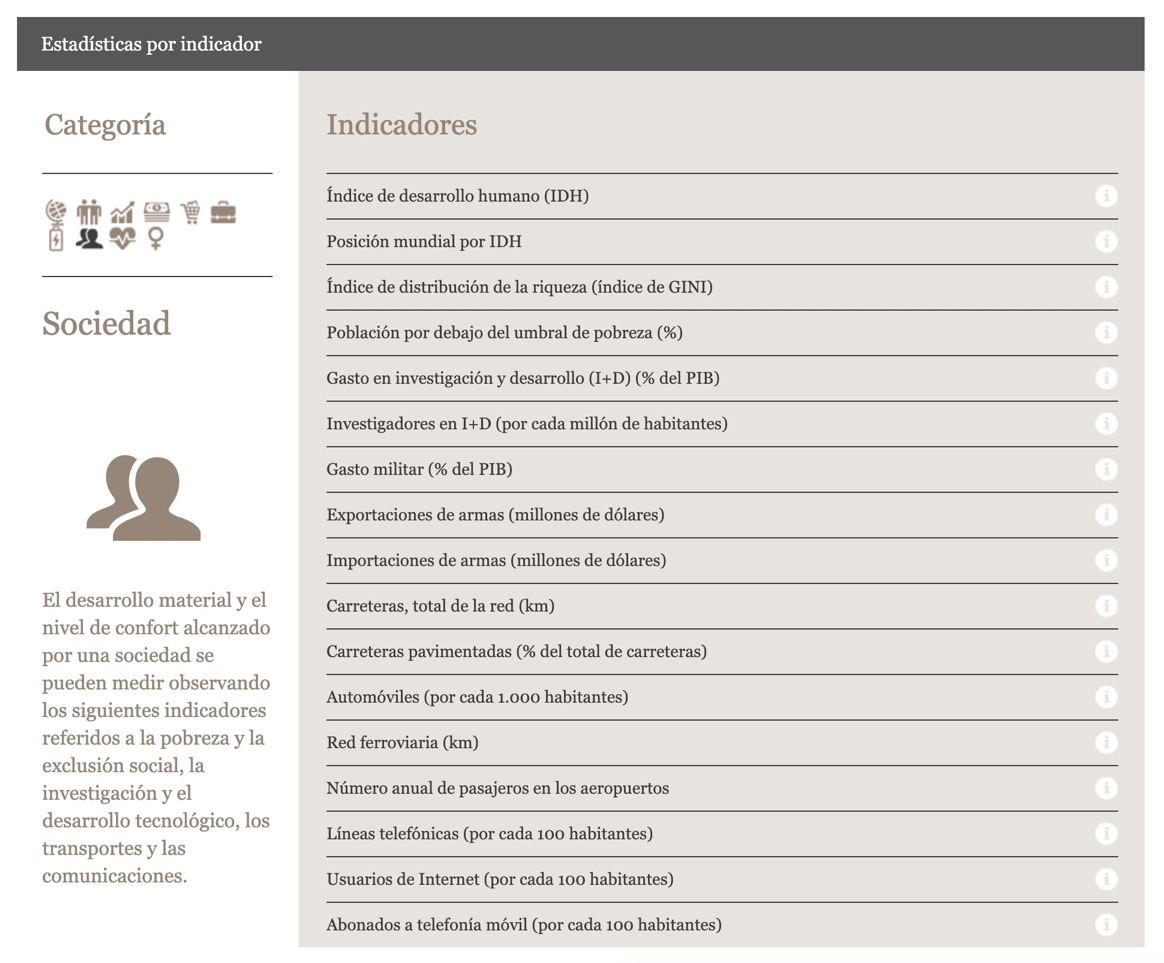
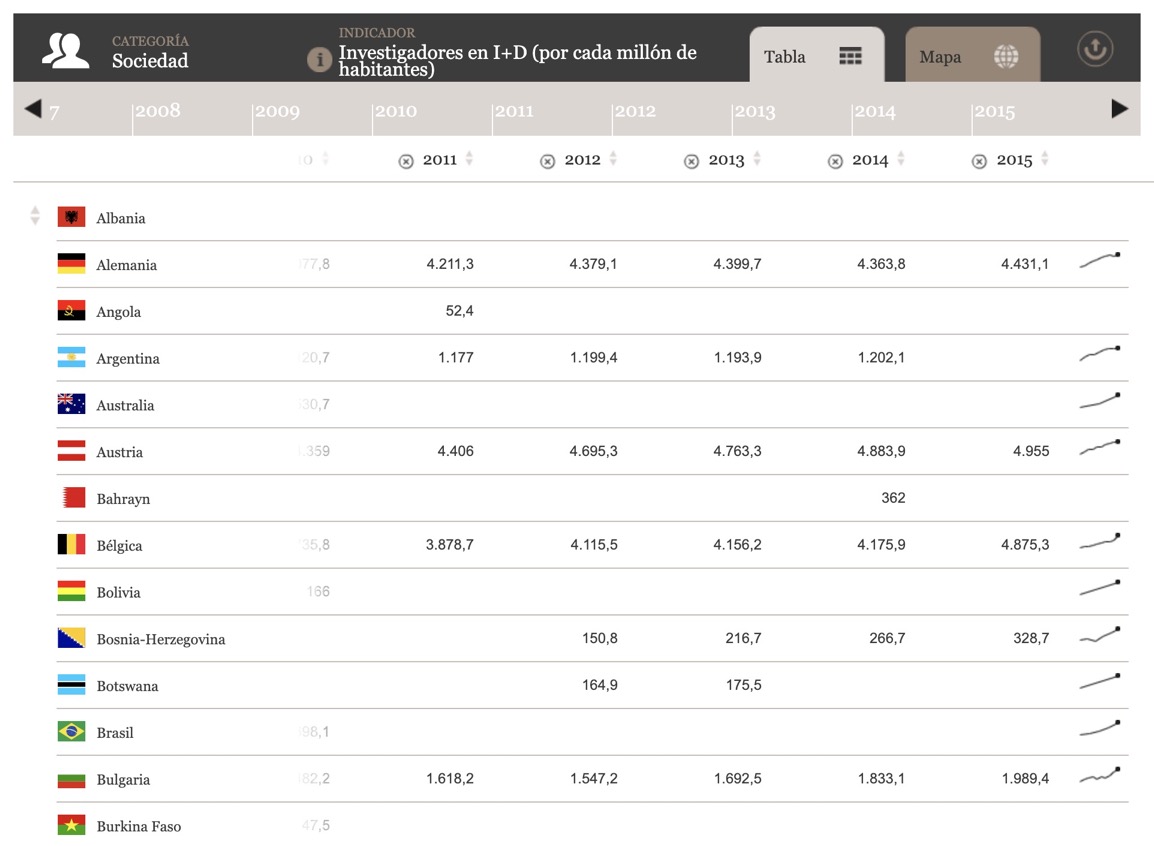
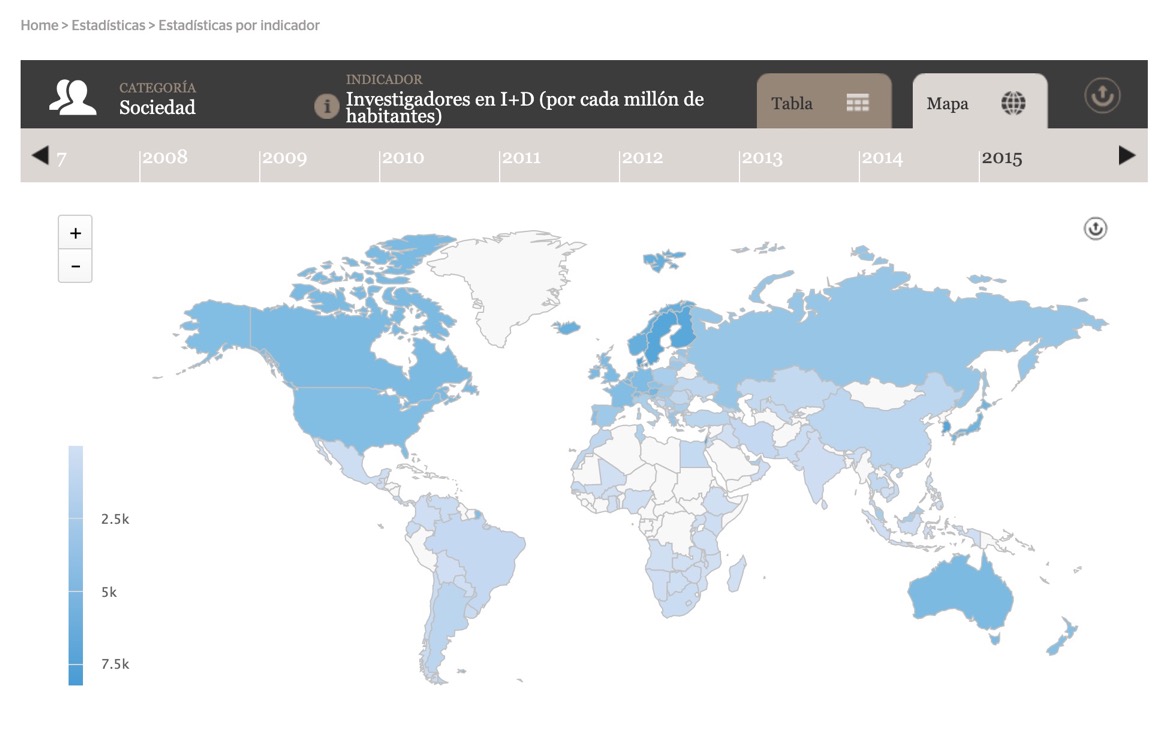
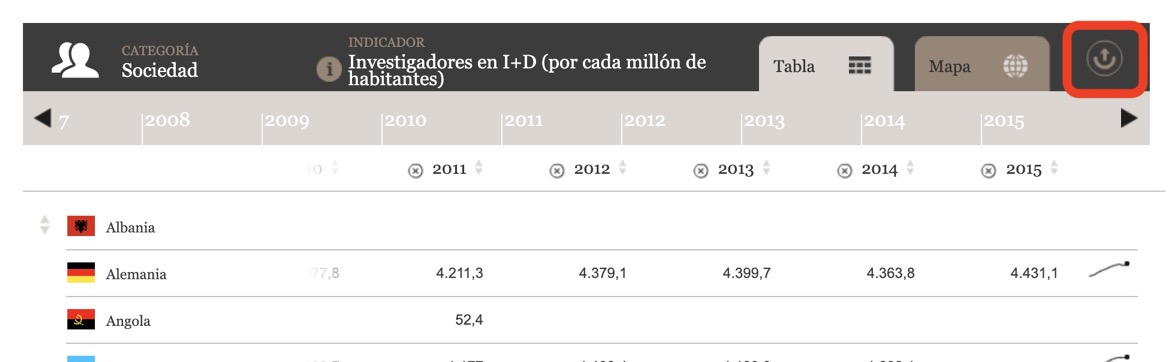
Choose estadísticas por indicador to view statistics by indicator. This feature allows users to discover the differences between countries in relation to a specific indicator and its historical evolution.

  1. Choose estadísticas por indicador.
    by country
  2. Select a category: physical characteristics, population, demographics, economy, trade, work, energy, society, education and health, and gender.
    categories
  3. Choose an indicator.
    indicators
  4. Explore the data as a table or on a map.
    table
    map
  5. Click the download icon in the top right corner to download the data as a .csv file.
    download

Statistical comparator

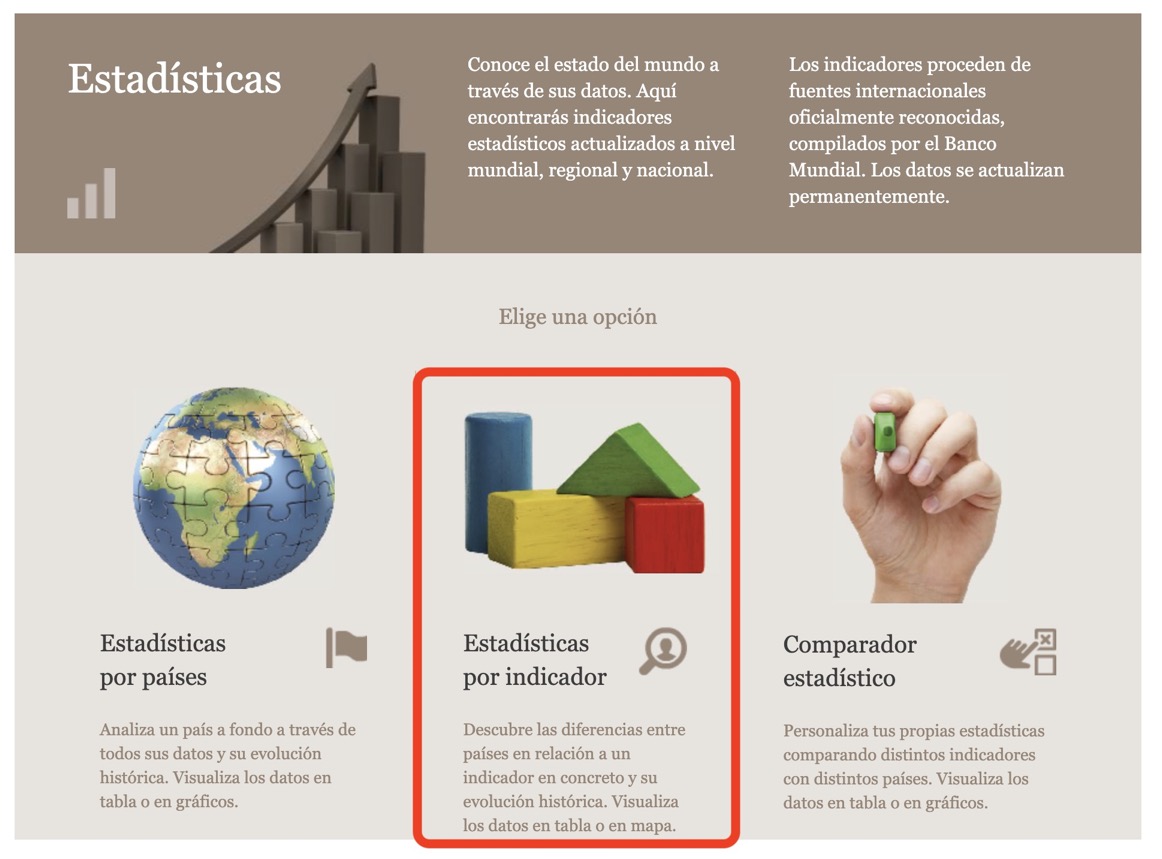
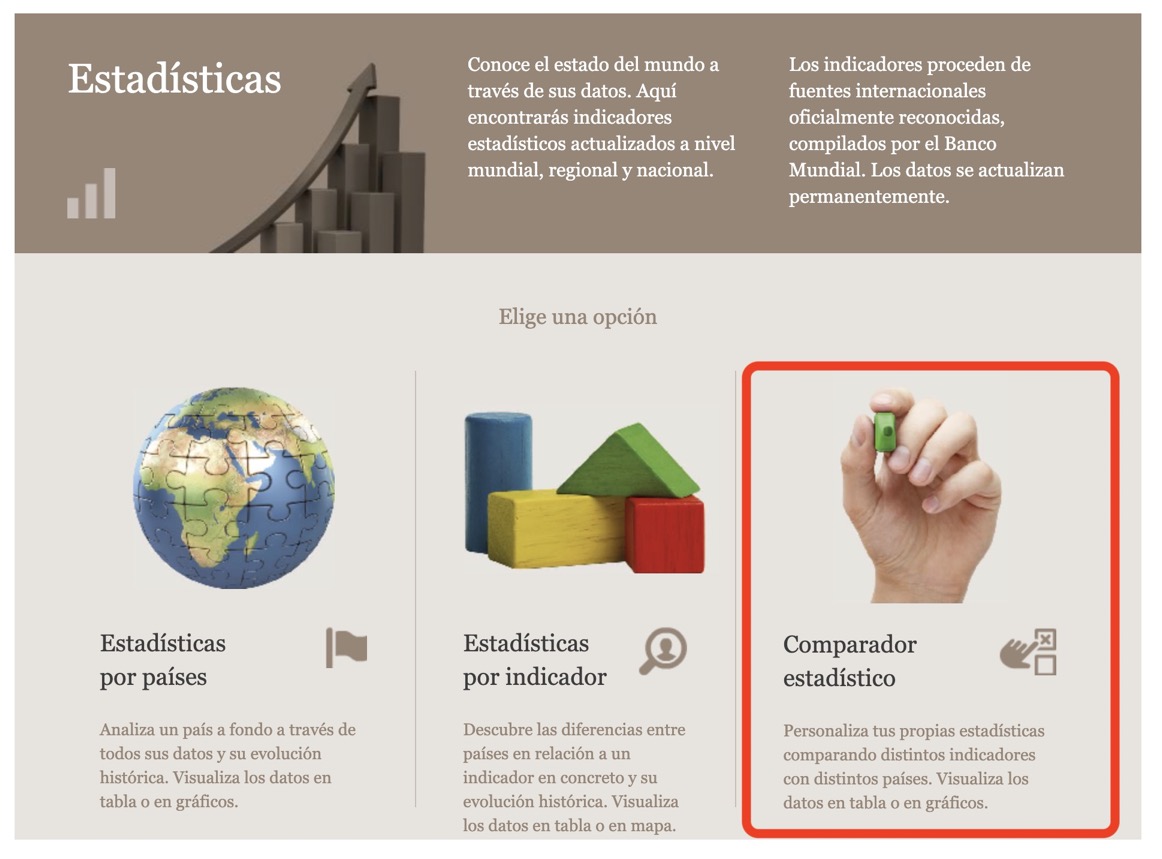
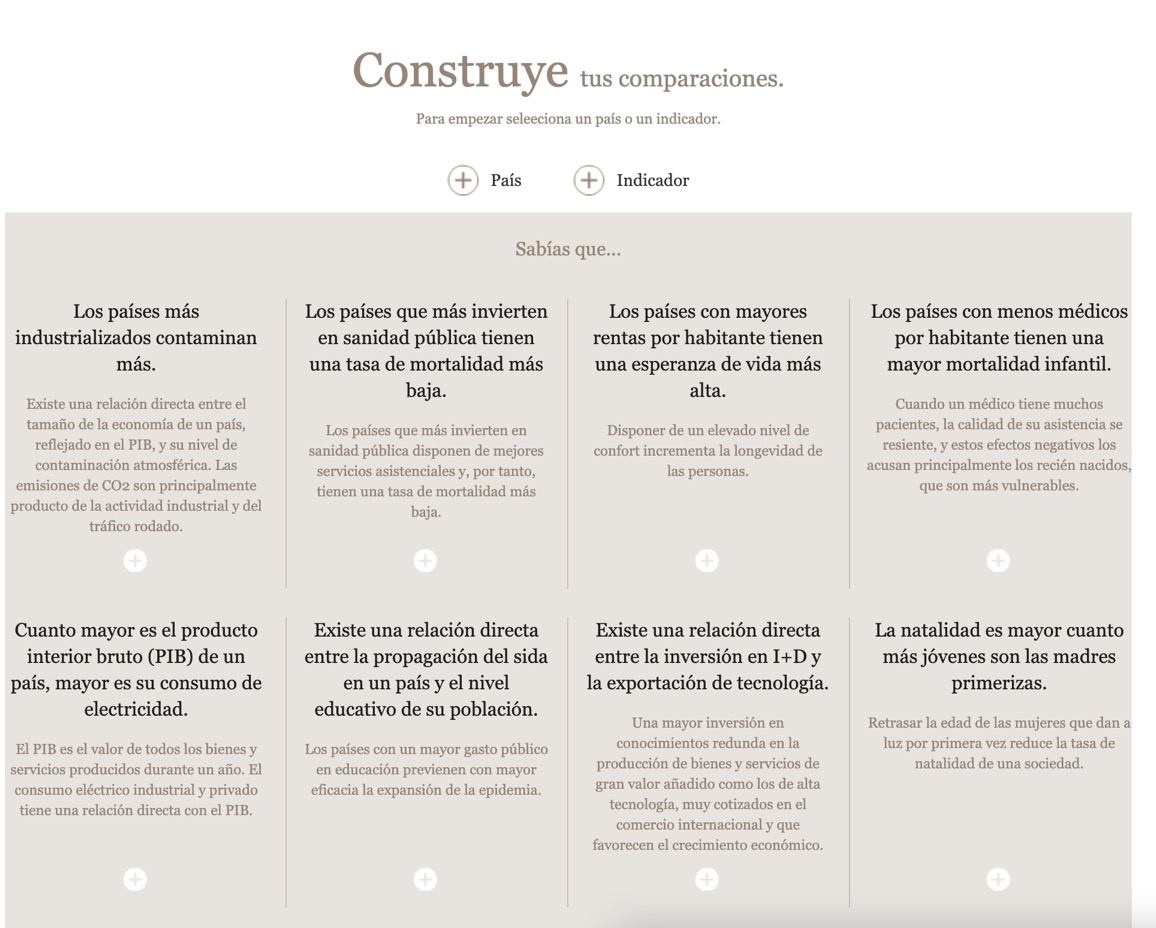
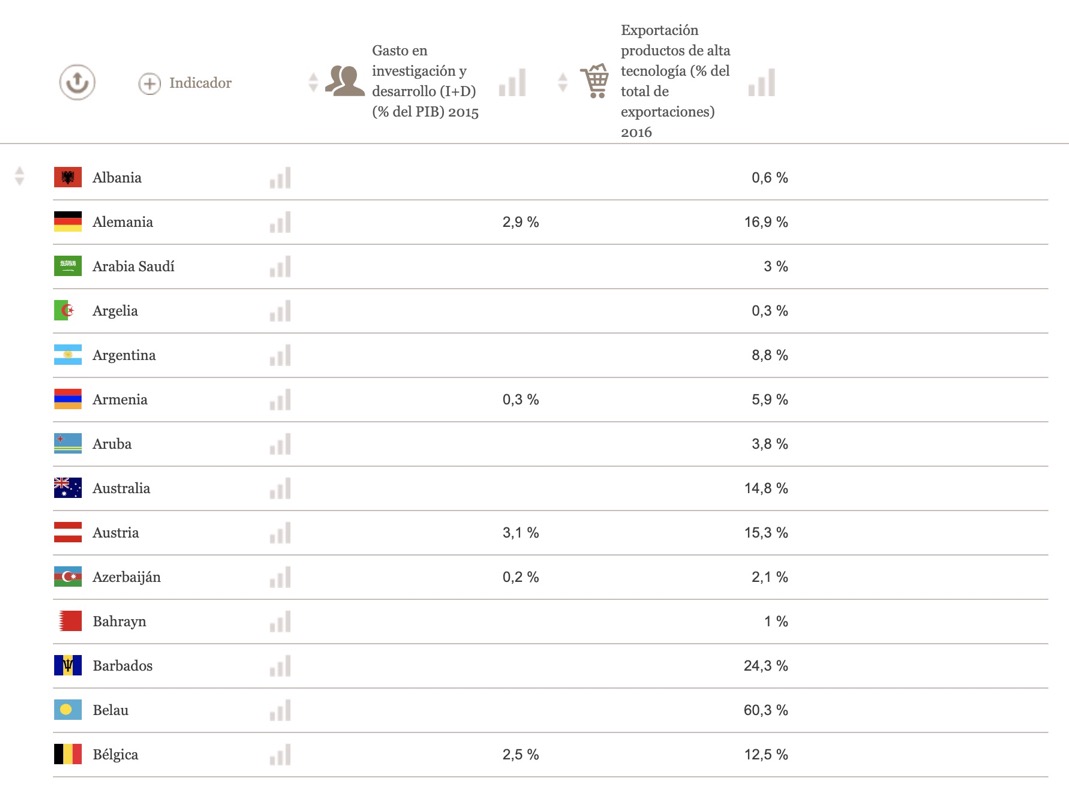
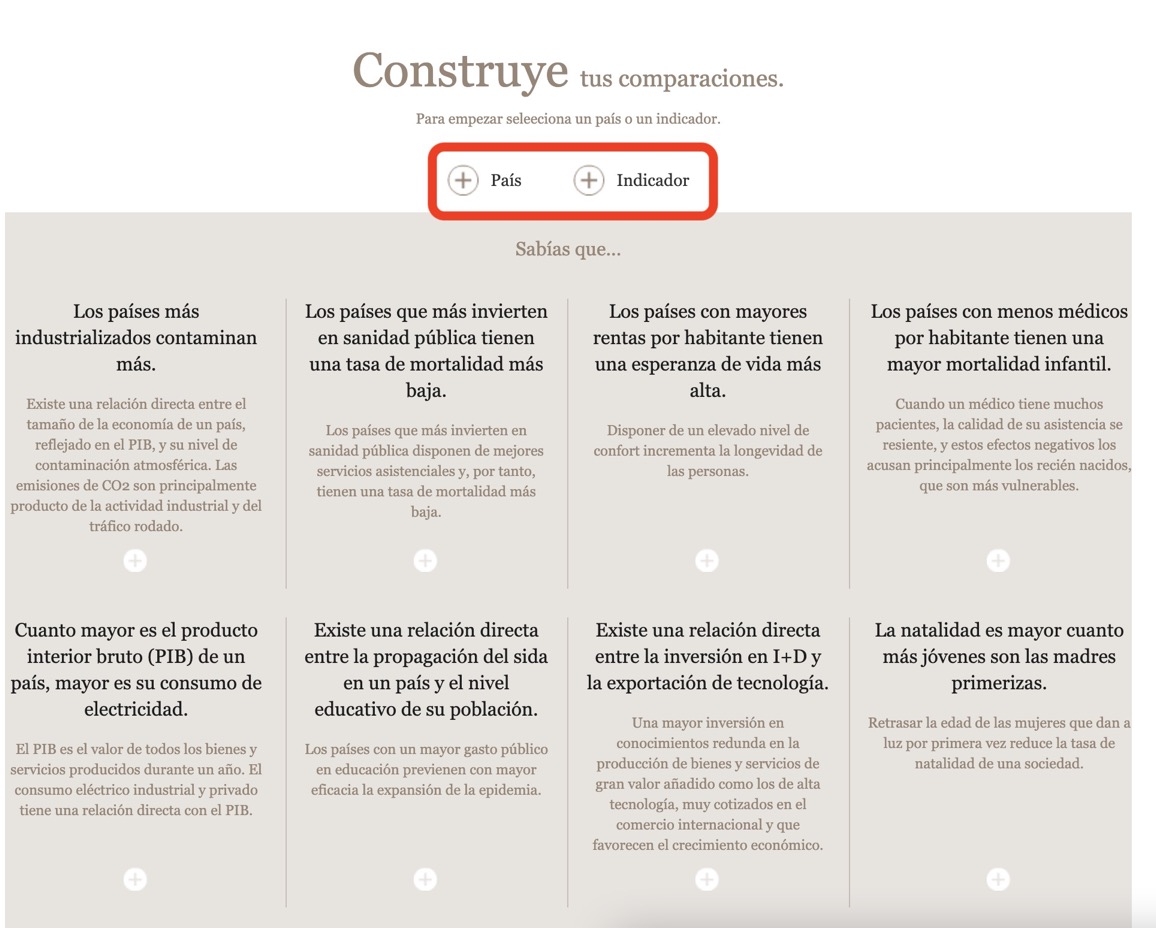
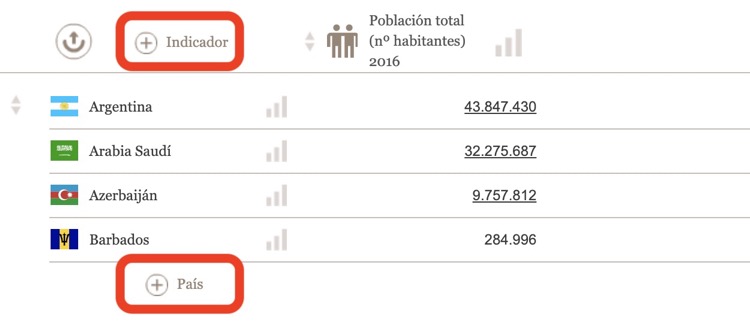
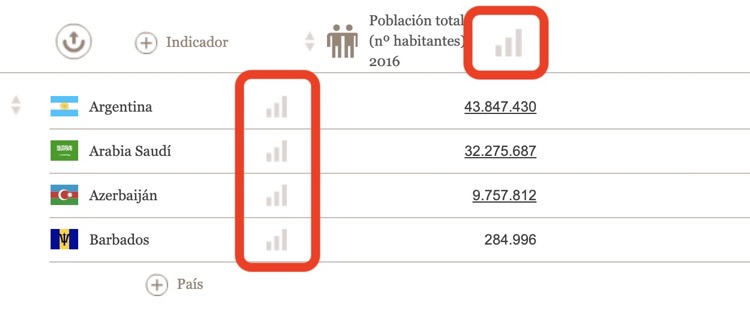
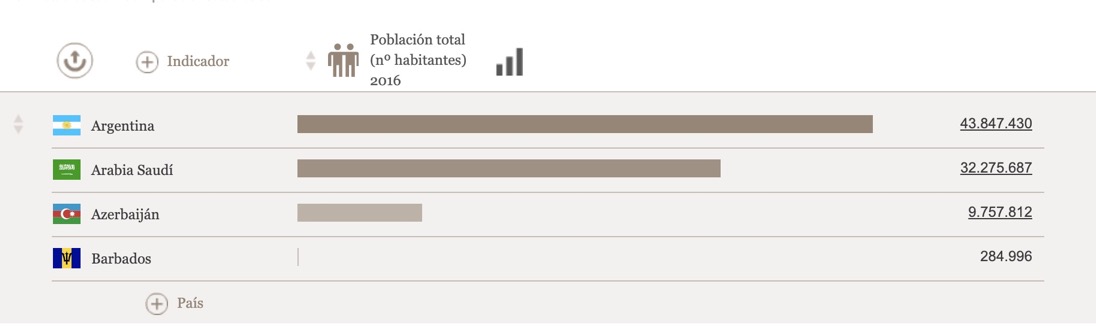
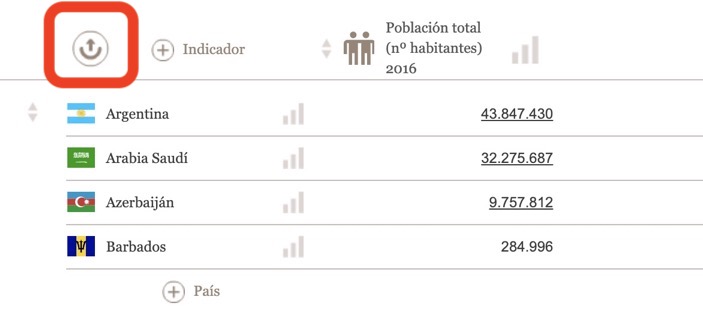
Choose comparador estadístico to customize your own statistics by comparing different indicators with different countries.

  1. Choose comparador estadístico to begin.
    compare
  2. Explore existing comparisons.
    existing comparisons
    comparison table
  3. Or create your own tables using the País and Indicador buttons at the top of the page.
    indicators
  4. Add or remove countries or indicators.
    add or remove
  5. Click the chart icon to view the associated graphs.
    chart icon
    graph
  6. Click the download icon in the top left corner to download the data as a .csv file.
    download
chatsimple